
Home > Browse by Institution > Australian Institute of Marine Science > Tropical Cyclones on the northwest Australian coast
Tropical Cyclones on the northwest Australian coast
- Ningaloo Atlas
- Australian Institute of Marine Science
The northwest Australian coastline between Broome and Exmouth is the most cyclone-prone region of Australia. On average approximately five Tropical Cyclones occur during each cyclone season over the warm ocean waters off the northwest coast between 105°E and 125°E - with about two cyclones crossing the coast each season. In fact, 75 % of severe cyclone crossings in Australia (1970 to 2008) have occurred on the northwest Australian coastline.
The Australian cyclone season officially runs from November to April, although very few have occurred in November (Figure 1). At the start of the cyclone season, the most likely area to be affected by Tropical Cyclones is the Kimberley and Pilbara regions, with areas further south (including the Ningaloo Coast) more likely to be affected later in the season. The chance of experiencing a category 4 or 5 cyclone is highest in March and April (Figure 1).
| click image for larger image view |
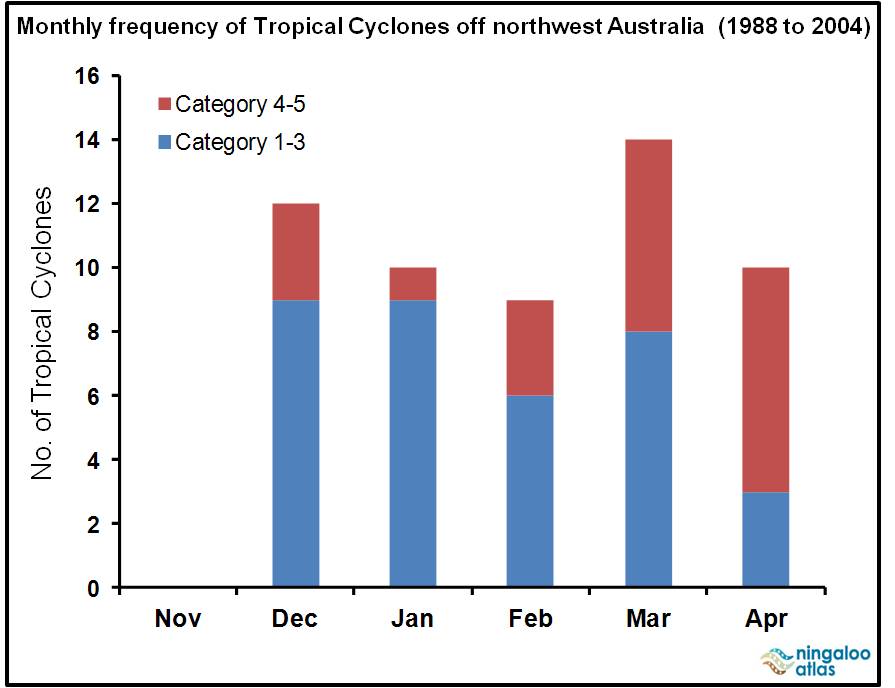 |
Figure 1. Monthy frequency of Tropical Cyclones off northwest Australia (1988 to 2004). Data extracted from the Bureau of Meteorology. |
While Tropical Cyclones can move in many different directions, off the northwest Australian coast they generally follow a much more predictable path than off the Queensland coast. In the northwest, Tropical Cyclones usually initially head to the west-southwest at speeds of 5-20 km/h and then take a more southerly track as they move further to the south. If they do move south of about 22°S or cross the Pilbara coast they tend to curve to the south-southeast and accelerate.
What are Tropical Cyclones?
Tropical Cyclones are low pressure systems that form over warm tropical waters, have gale force winds (sustained winds of ≥ 63 km/h and gusts > 90 km/h) near the centre, and generally have a distinct life cycle of approximately 4 to 7 days. Tropical Cyclones derive their energy from the warm tropical oceans and do not form unless the sea surface temperature is > 26.5°C - although once formed they can persist over lower sea surface temperatures.
The severity of a Tropical Cyclone is described in terms of categories ranging from 1 to 5 related to the zone of maximum winds (Table 1).
Table 1. Tropical Cyclone categories, wind speed, and ocean swell size. |
||
| Category | Wind gusts | Ocean swells |
| 1 | ≤ 125 km/hr. Gales. | 1.2 – 1.6 m |
| 2 | 126 – 169 km/hr. Destructive. | 1.7 – 2.5 m |
| 3 | 170 – 224 km/hr. Very destructive. | 2.6 – 3.7 m |
| 4 | 225 – 279 km/hr. Very destructive. | 3.8 – 5.4 m |
| 5 | > 280 km/hr. Very destructive. | > 5.5m |
Trends in cyclone activity in the Australian region (105°E to 160°E) show that the total number of Tropical Cyclones has decreased in recent decades, but the number of severe cyclones has increased during this time.
The Bureau of Meteorology’ Current Tropical Cyclones resource provides more information and current updates on Tropical Cyclones in Australia.
Tropical Cyclones on the Ningaloo Coast
Due to its location on the southern end of Australia’s most cyclone-prone region, the Ningaloo Coast has a history of cyclone events. Tropical Cyclones that impact the Ningaloo Coast typically form over warm ocean waters to the north and steer to the southwest where they tend to take a more southerly track as they move further south. Most notably, in March 1999 Tropical Cyclone Vance moved down the Exmouth Gulf causing winds recorded to 267 km/h (the highest ever wind gust measured on the Australian mainland).
Along the Ningaloo Coast the cyclone season runs from mid-December to April, peaking in February and March (Figure 2). Overall it is estimated that a cyclone impact causing wind gusts in excess of 90 km/h in the vicinity of Exmouth occurs about once every two to three years on average. Given that cyclones generally weaken as they move southwards over cooler water and to latitudes where the atmospheric winds are unfavourable for cyclones, Carnarvon generally experiences less cyclones than the central and northern Ningaloo Coast.
| click image for larger image view |
 |
Figure 2. Monthy frequency of Tropical Cyclones on the Ningaloo Coast (1910 to 2004). Data extracted from the Bureau of Meteorology. |
Due to the active cyclone history of the Ningaloo Coast, there has been recorded damage to property – Table 2 provides a snap shot of the most notable Tropical Cyclones post-1963. The development of the offshore oil and gas and the tourism industry along the Ningaloo Coast has increased the damage potential of Tropical Cyclones in the region – due to property damage, service disruptions, flooding, production shut downs, and disruptions to shipping activities. Fortunately modern structures are built according to cyclone wind ratings and are less susceptible to damaging winds than earlier constructions.
Table 2. Notable Tropical Cyclones along the Ningaloo Coast (post-1963). Information extracted from the Bureau of Meteorology. |
|||
Exmouth |
|||
| Date | Tropical Cyclone | Wind speed | Description of damage |
| 29/03/1964 | Katie | 213 km/h | The construction camp at Learmonth was damaged. The US Navy barracks at Northwest Cape was severely damaged. Exmouth Gulf recorded 246 mm of rain. |
| 01/02/1970 | Glynis | 213 km/h | In the Exmouth Gulf roofs of over 60 houses were damaged. Two houses were completely unroofed, several other buildings were wrecked or substantially damaged, and 20 caravans damaged beyond repair. |
| 15/02/1970 | Ingrid | not recorded | Thirty houses damaged and 18 m of the Learmonth fishing jetty was destroyed. |
| 31/03/1975 | Beverley | 152 km/h | Three prawn trawlers were blown onto the beach. Structural damage was caused to the Pistol Club, the Yacht Club and Norcape Lodge. Both the Learmonth and Coral Bay jetties were damaged. |
| 22/03/1999 | Vance | 267 km/h | Damage to Exmouth was extensive although most modern buildings withstood the winds. A 3.5 m storm surge caused widespread damage near the marina. |
Onslow |
|||
| Date | Tropical Cyclone | Wind Speed | Description of damage |
| 10/03/1965 | John | not recorded | Power was cut off and an 8,000 litre tank was blown away from Onslow airport. |
| 19/02/1975 | Trixie | 247 km/h | Damage was reported all along the Pilbara coast. Mardie recorded a wind gust of 259 km/h and Onslow reported 247 km/h. The Onslow Meteorological Office was destroyed and many houses seriously damaged. Onslow recorded 246 mm of rain. |
| 26/02/1975 | Bobby | 183 km/h | Seven lives were lost when two fishing trawlers were sunk off the coast from Onslow. Onslow received 425 mm in 2 days. Wind damage was relatively minor at Onslow. |
| 10/04/1996 | Olivia | 257 km/h | Extensive damage to the offshore oil and gas industry around Barrow Island. Varanus Island recorded wind gusts to 267 km/h. |
| 22/03/1999 | Vance | 182 km/h | The estimated 4 m storm surge inundated the lower parts of Onslow. Further west the storm surge was estimated at 5 m and caused severe coastal erosion and widespread denudation of vegetation. |
Carnarvon |
|||
| Date | Tropical Cyclone | Wind Speed | Description of damage |
| 15/02/1970 | Ingrid | 132 km/h | Some houses were unroofed, five caravans were overturned, power lines brought down and citrus and banana crops were destroyed. |
| 31/03/1975 | Beverley | 111 km/h | Three prawn trawlers were washed ashore. Up to half the Carnarvon banana crop was ruined. |
| 13/03/1979 | Hazel | 137 km/h | The Carnarvon Hotel was unroofed and damage to bananas was estimated at $2 million. A storm surge at Denham flooded buildings forcing people to evacuate. |
| 21/05/1988 | Herbie | 121 km/h | Structural damage recorded at Denham and Carnarvon. The Korean Star, a 30,000 tonne freighter was wrecked at Cape Cuvier. A 2 m storm surge flooded the Denham foreshore. |
Tracks of past Tropical Cyclones along the Ningaloo and northwest Australian coasts can be accessed by the Bureau of Meteorology’s Interactive Tropical Cyclone Plotter.


