Home > Browse by Themes > Oceanography > Summer 2011/12 sea surface temperature summary for Western Australia
Summer 2011/12 sea surface temperature summary for Western Australia
- Ningaloo Atlas
- Australian Institute of Marine Science
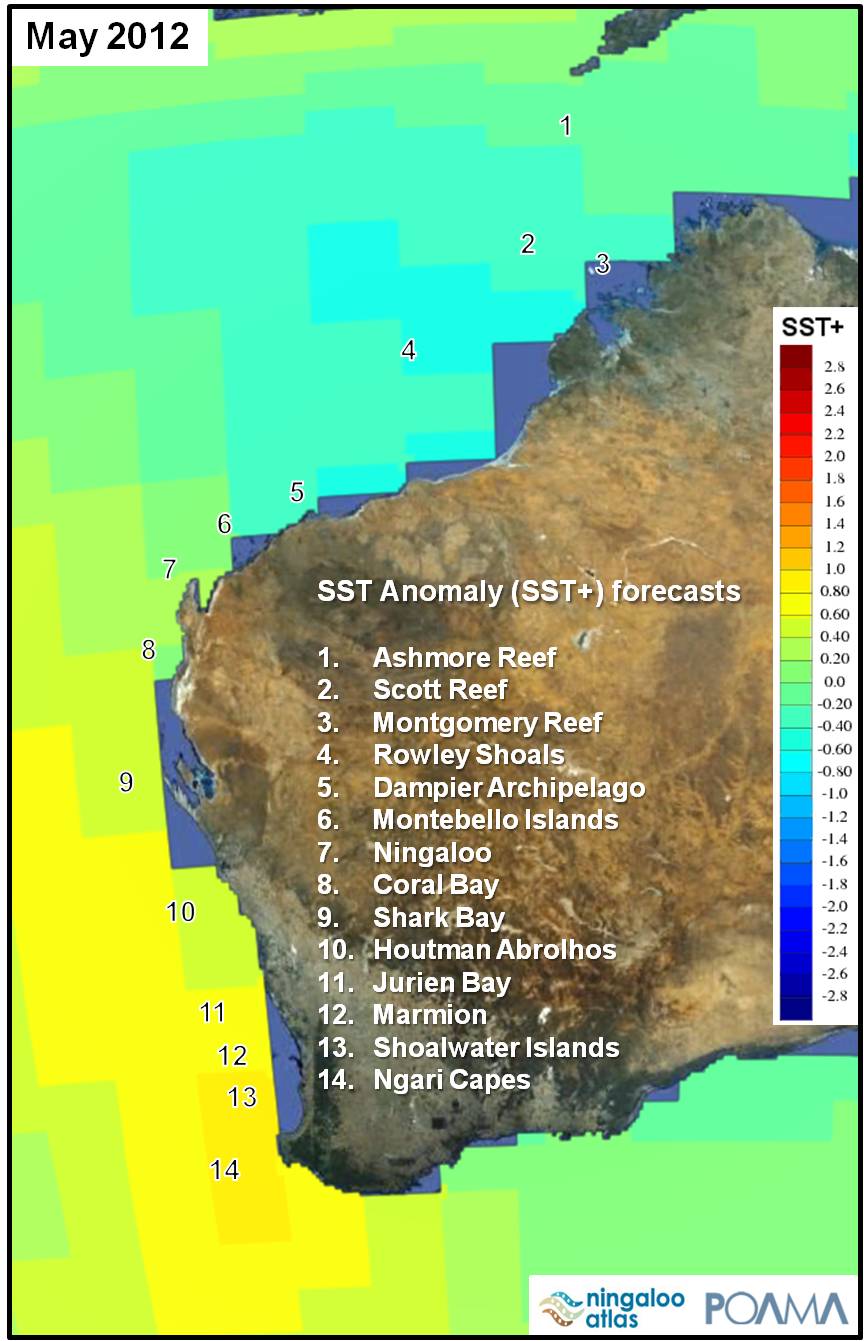
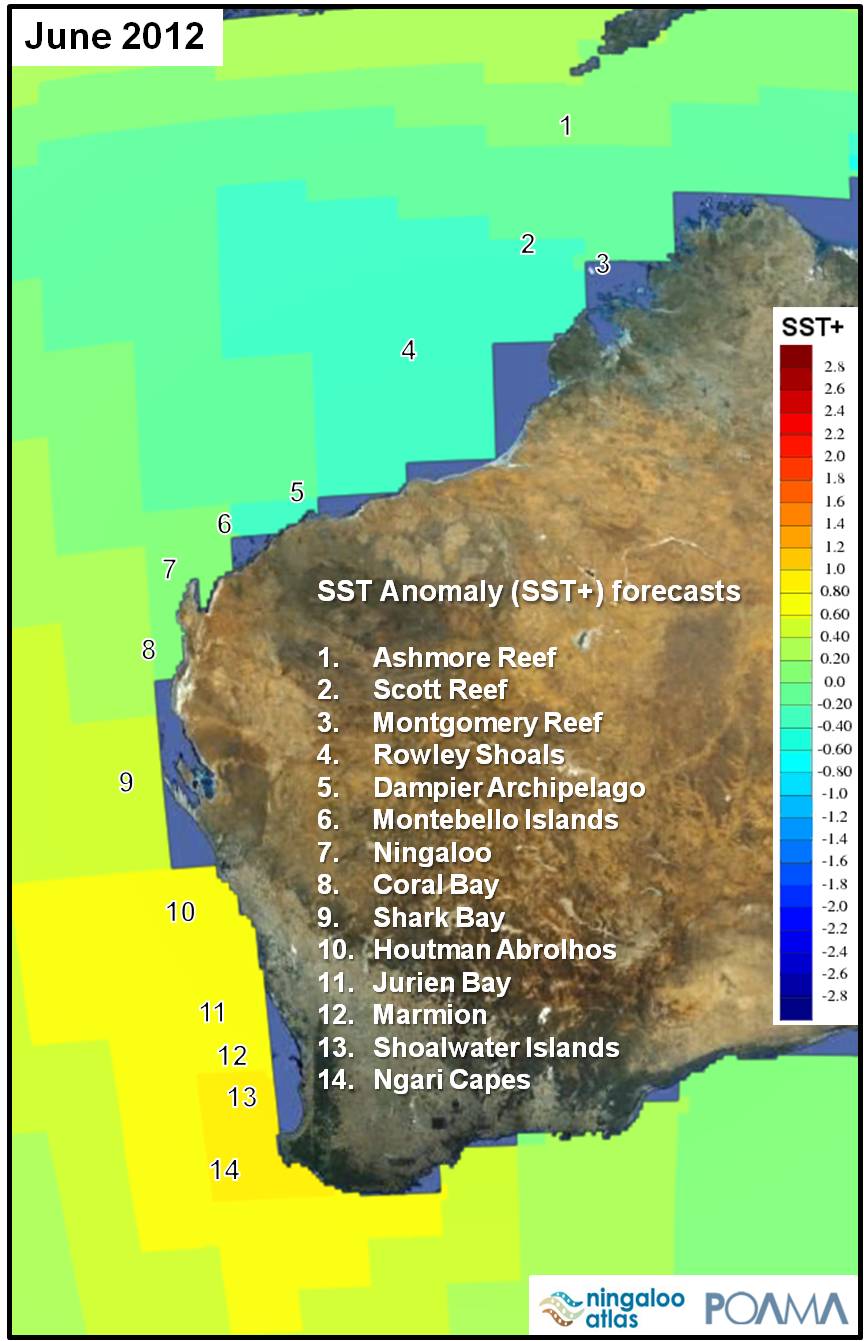
A number of online sea surface temperature SST products are available that provide a seasonal outlook of the likelihood bleaching will occur, and tools that enable near-real time monitoring of temperature stress during the summer months. Example images from these online SST products have been extracted for Western Australia to provide a digital archived SST summary for the summer 2011/12 and to demonstrate how they can be used in a regional context.
The information has been provided for 14 locations in Western Australia which are based on the NOAA Coral Reef Watch virtual stations.
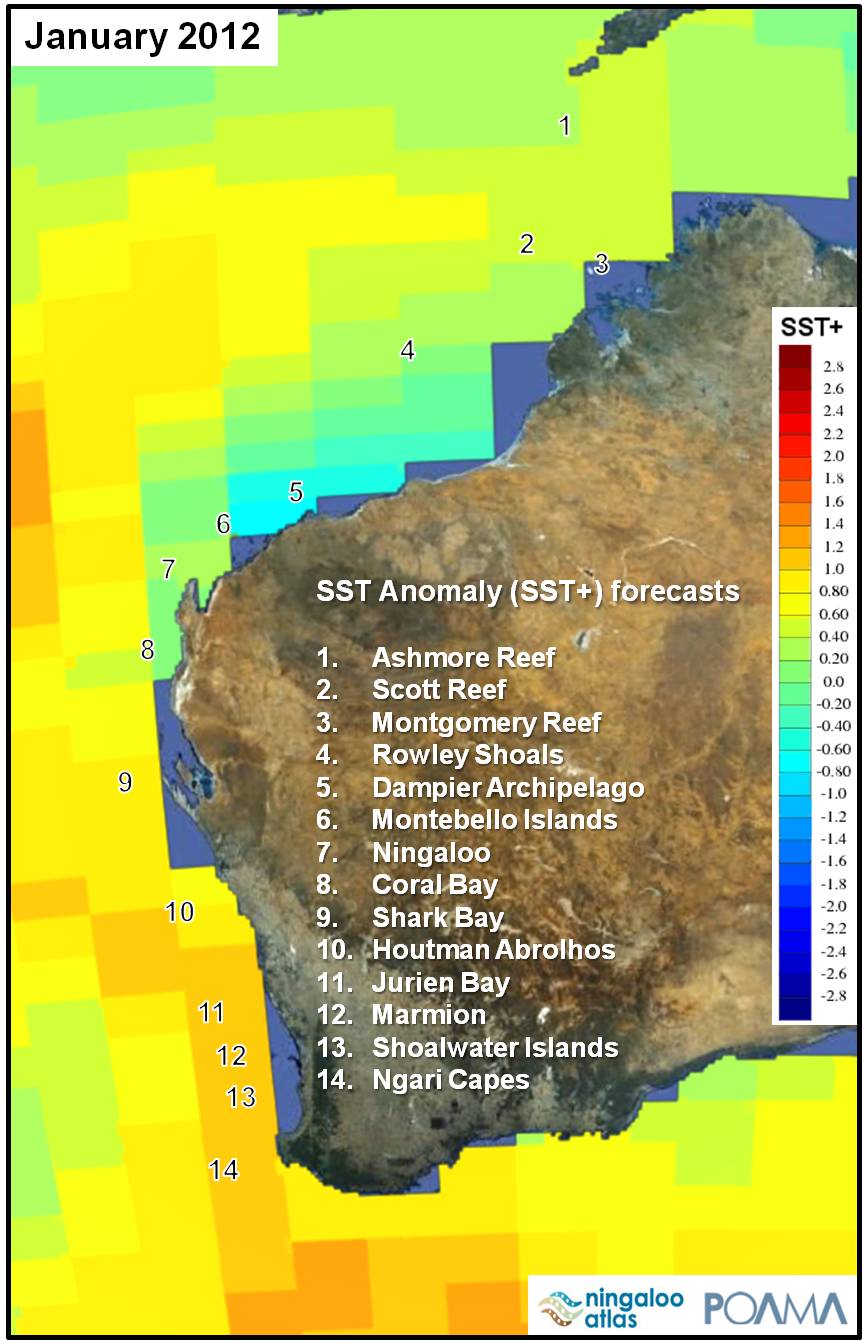
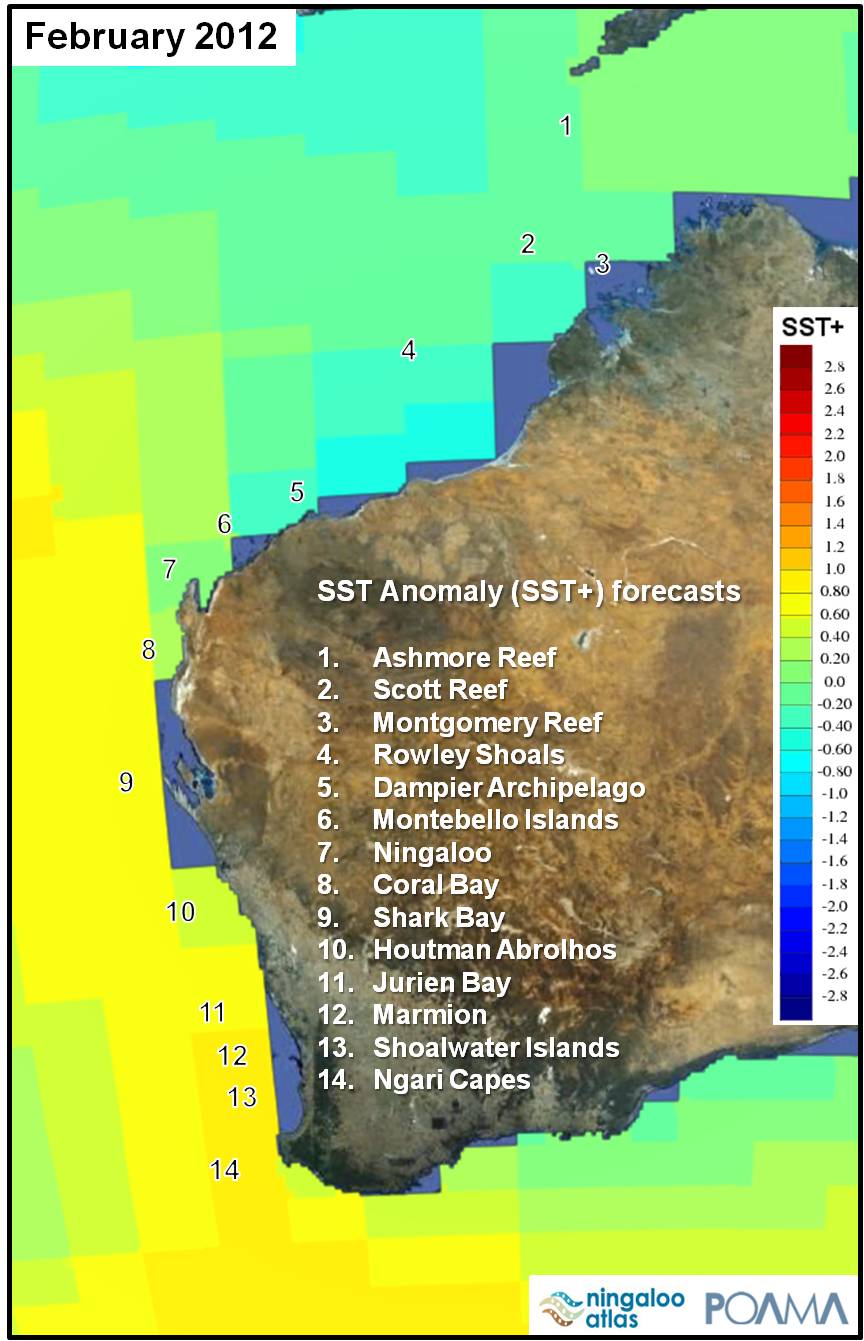
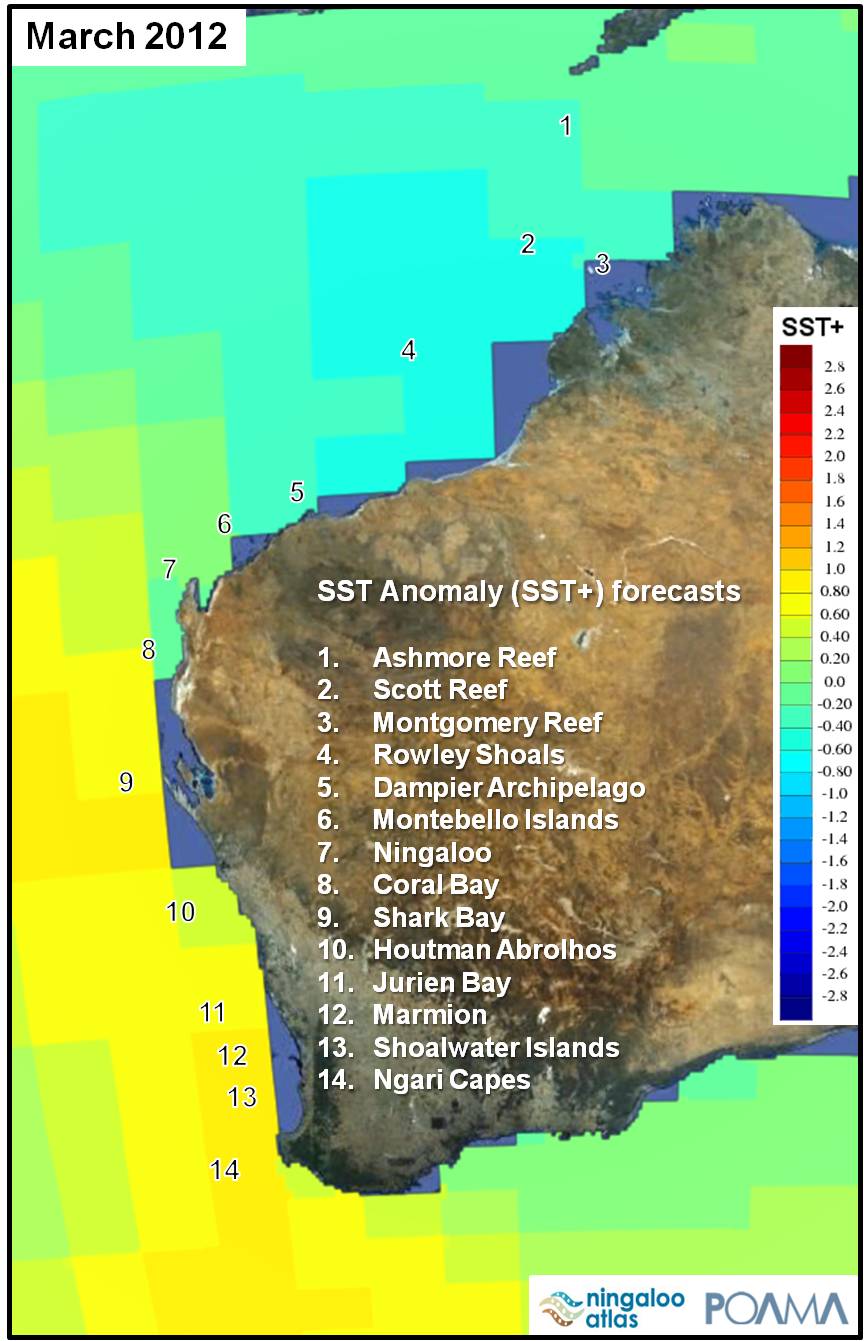
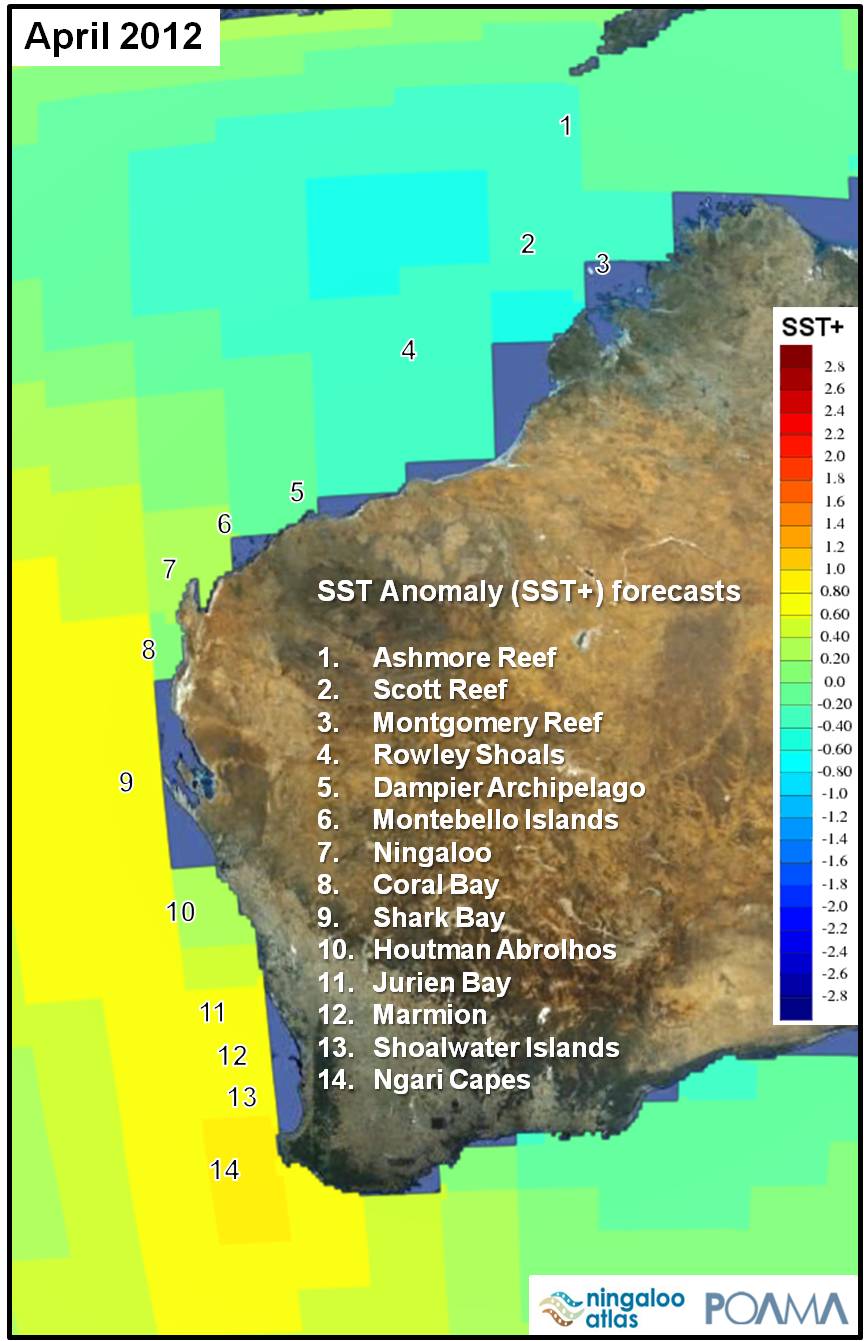
POAMA SST anomalies (SST+) forecasts
POAMA provides a seasonal outlook ahead in time (forecasts) and SST+ are calculated as the difference between SST values and the monthly long term mean SST.
| click image for larger image view | |||||
|
January 2012 |
February 2012 |
March 2012 |
April 2012 |
May 2012 |
June 2012 |
Figure 1. Monthly POAMA SST+ forecast for Western Australia - January to June 2012. Data extracted and reworked from http://poama.bom.gov.au/gearth/gearth.shtml. |
|||||
NOAA's Coral Reef Watch degree heating weeks (DHW)
DHWs is an accumulation of any temperature anomalies greater than 1°C over a 12-week window, which shows how stressful conditions have been for corals in the last three months. Past observations indicate that there is a correlation with bleached corals when DHW values of 4°C-weeks have been reached. By the time DHW values reach 8°C-weeks, widespread bleaching is likely and some mortality can be expected.
Table 1. Monthly DHW (values for beginning of each month) for Western Australia - January to June 2012. Data extracted and reworked from http://coralreefwatch.noaa.gov/satellite/vs/index.html and http://coralreefwatch.noaa.gov/satellite/vs_added/vs_wa_list_data.html. |
||||||
| Beginning January | Beginning February | Beginning March | Beginning April | Beginning May | Beginning June | |
| Ashmore Reef | 0 | 0 | 0 | 0 | 0 | 0 |
| Scott Reef | 0 | 0 | 0 | 0 | 0 | 0 |
| Montgomery Reef | 0 | 0 | 0 | 0 | 0 | 0 |
| Rowley Shoals | 0 | 0 | 0 | 0 | 0 | 0 |
| Dampier Archipelago | 0 | 0 | 0.5 | 0.5 | 0.5 | 0 |
| Montebello Islands | 0 | 0 | 0 | 0 | 0 | 0 |
| Ningaloo | 0 | 0 | 1.2 | 3.7 | 3.7 | 1.2 |
| Coral Bay | 0 | 1.2 | 2.9 | 10.3 | 11.4 | 7.9 |
| Shark Bay | 0 | 1.6 | 6.0 | 13.4 | 16.4 | 11.7 |
| Houtman Abrolhos | 0 | 2.8 | 8.7 | 13.4 | 9.4 | 2.2 |
| Jurien Bay | 0 | 4.1 | 9.4 | 16.9 | 15.3 | 7.5 |
| Marmion | 0 | 3.9 | 9.5 | 17.2 | 15.5 | 8.1 |
| Shoalwater Islands | 0 | 3.3 | 6.9 | 12.2 | 12.6 | 6.8 |
| Ngari Capes | 0 | 5.6 | 13.7 | 23.9 | 24.0 | 17.0 |
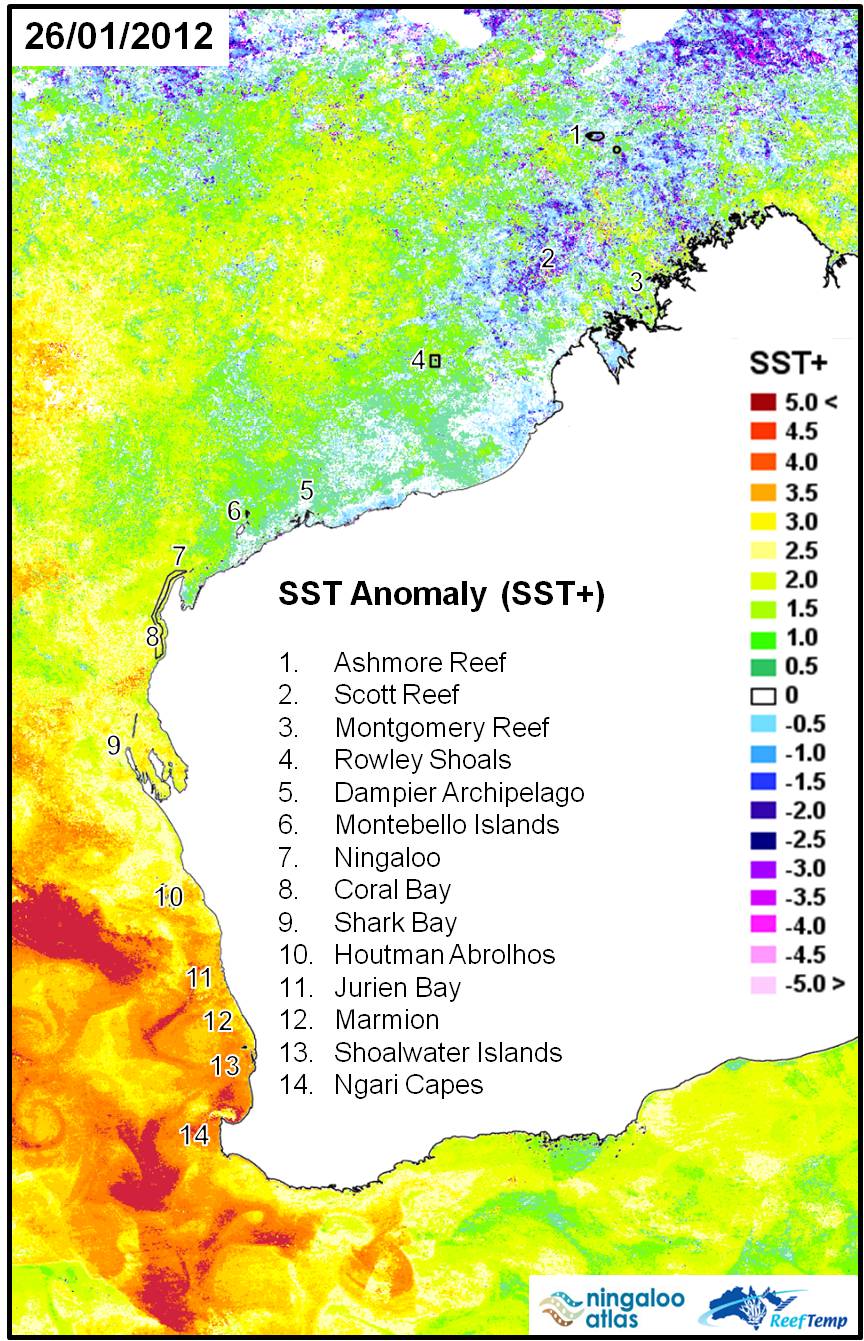
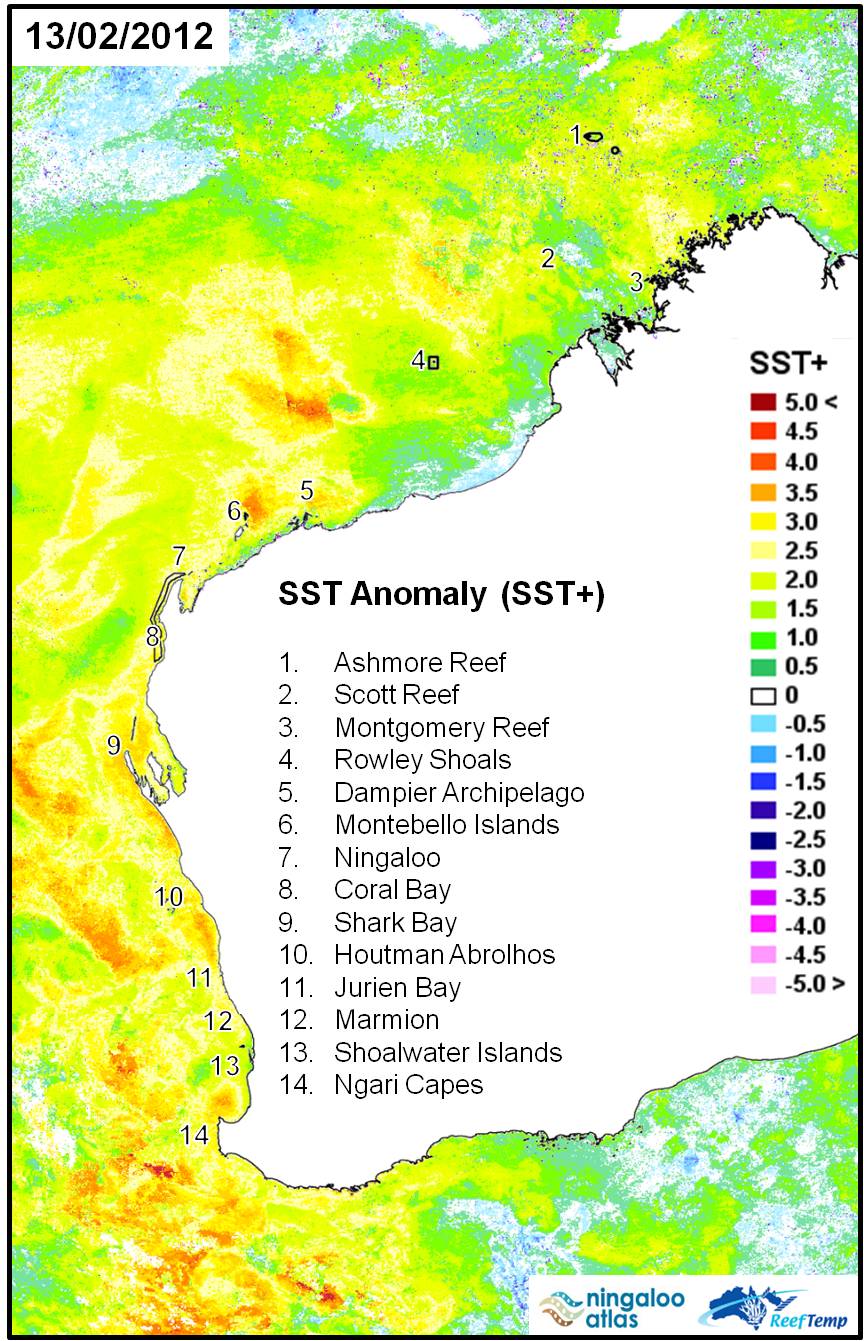
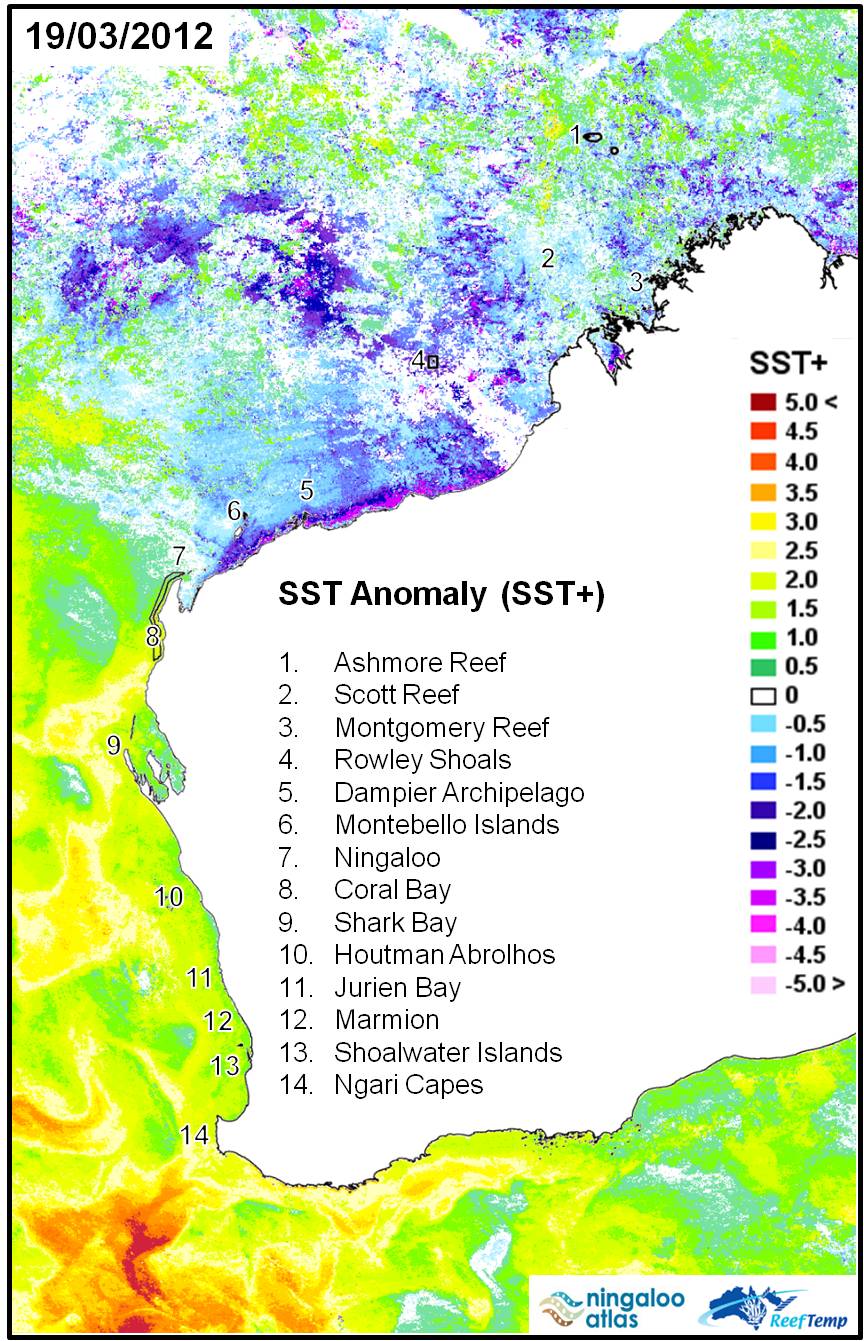
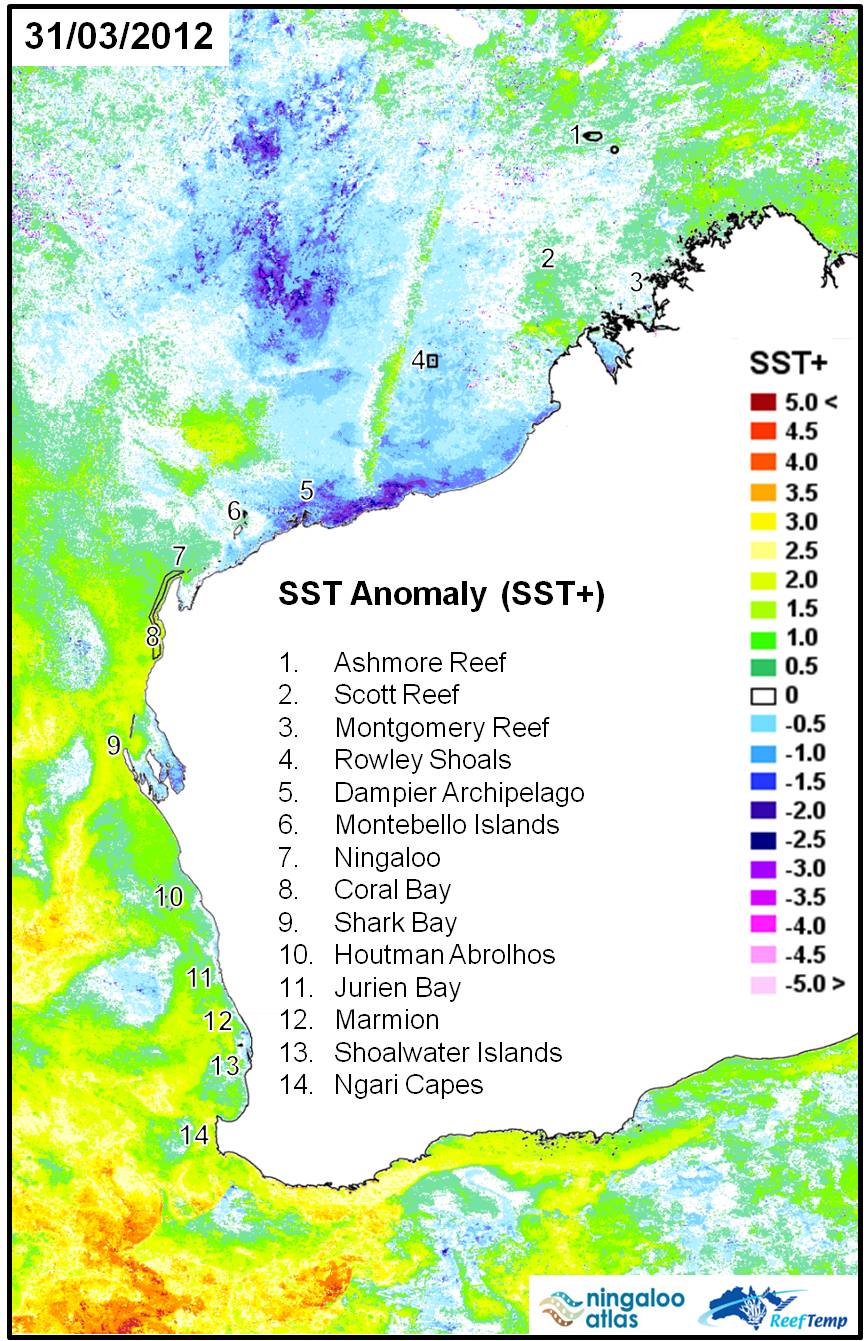
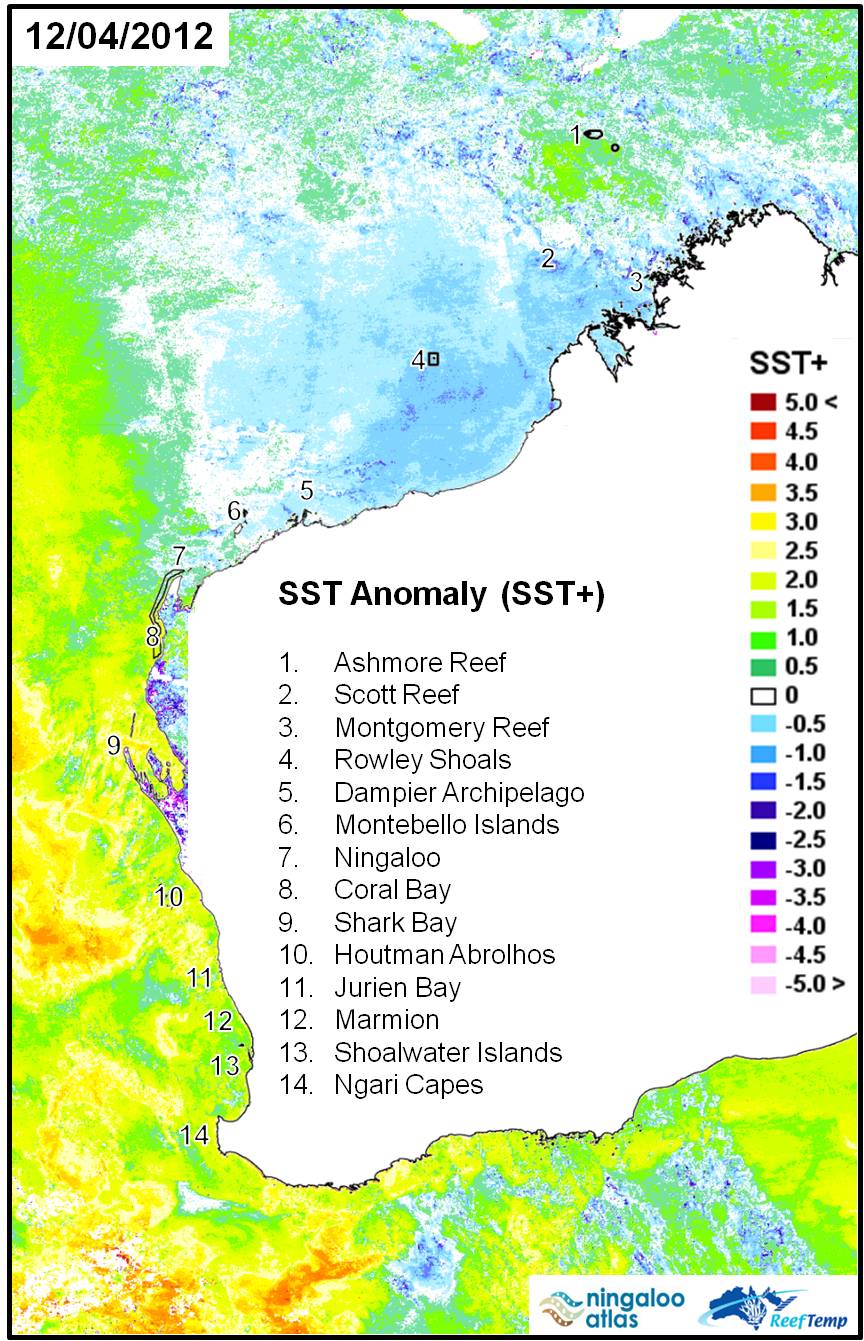
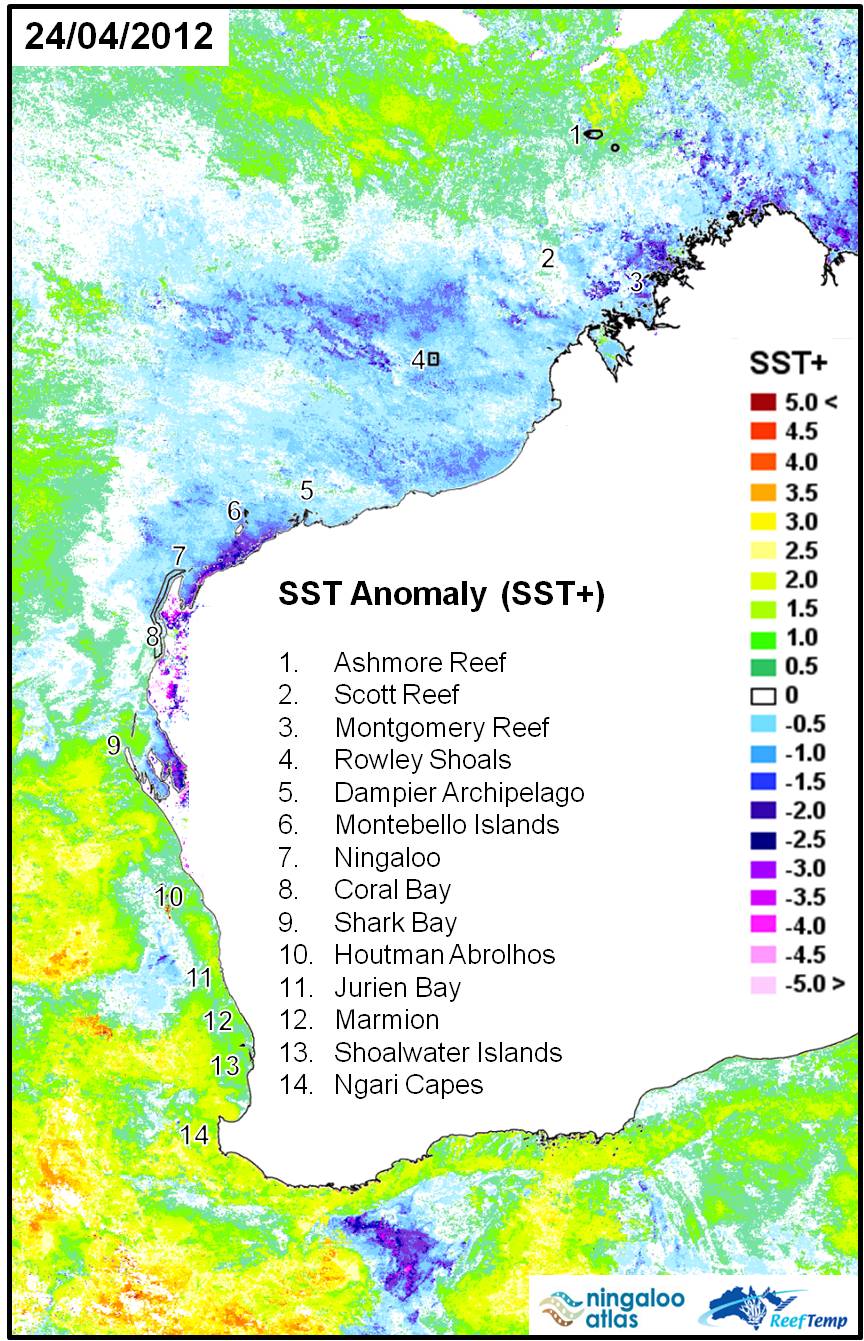
ReefTemp SST anomalies (SST+)
ReefTemp’s SST+ is calculated for each grid cell as the number of °C above the long-term average temperature observed for that month.
| click image for larger image view | |||||
|
26 January 2012 |
13 February 2012 |
19 March 2012 |
31 March 2012 |
12 April 2012 |
24 April 2012 |
Figure 2. Composite ReefTemp SST+ for Western Australia - selected dates January to April 2012. Data extracted and reworked from http://www.cmar.csiro.au/remotesensing/reeftemp/web/ReefTemp_application.htm. |
|||||
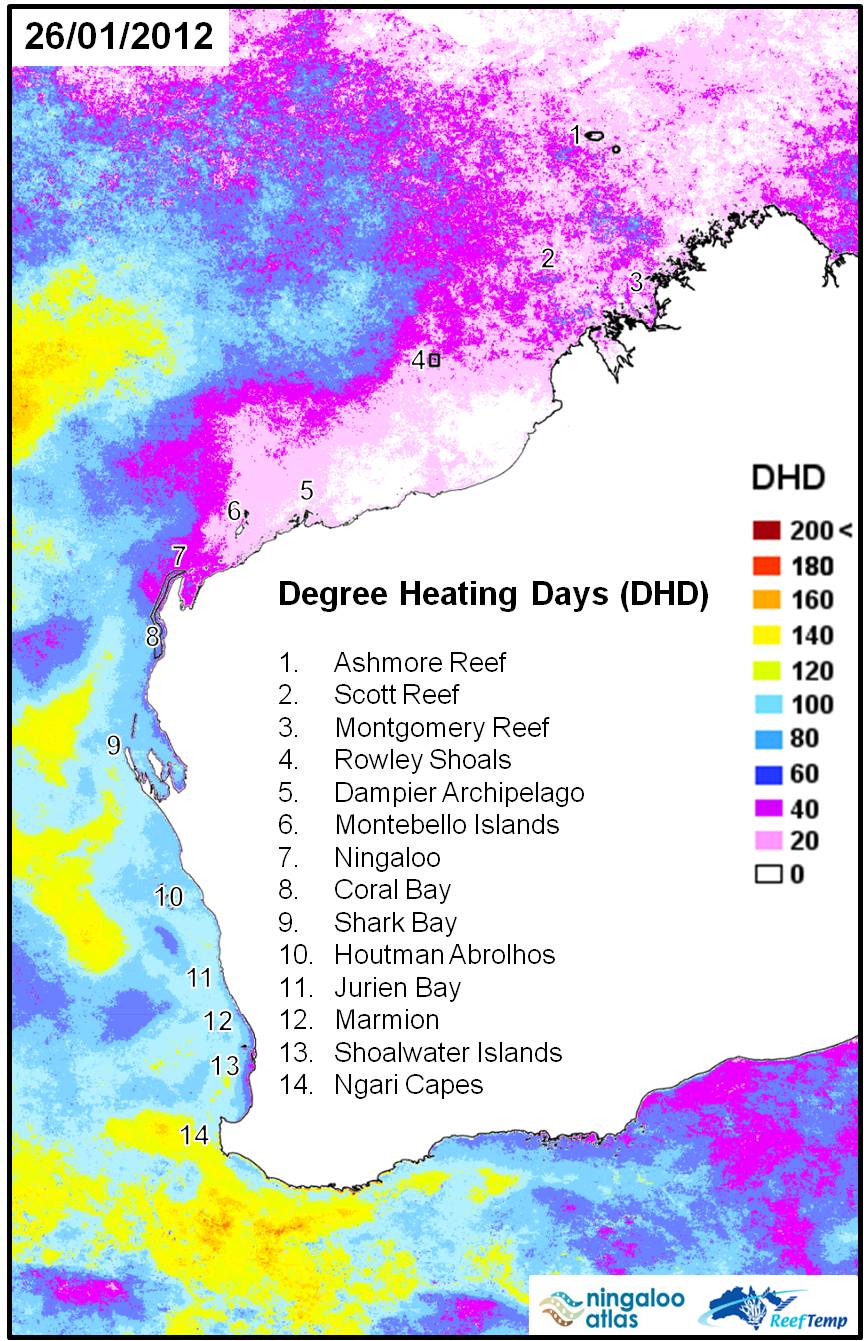
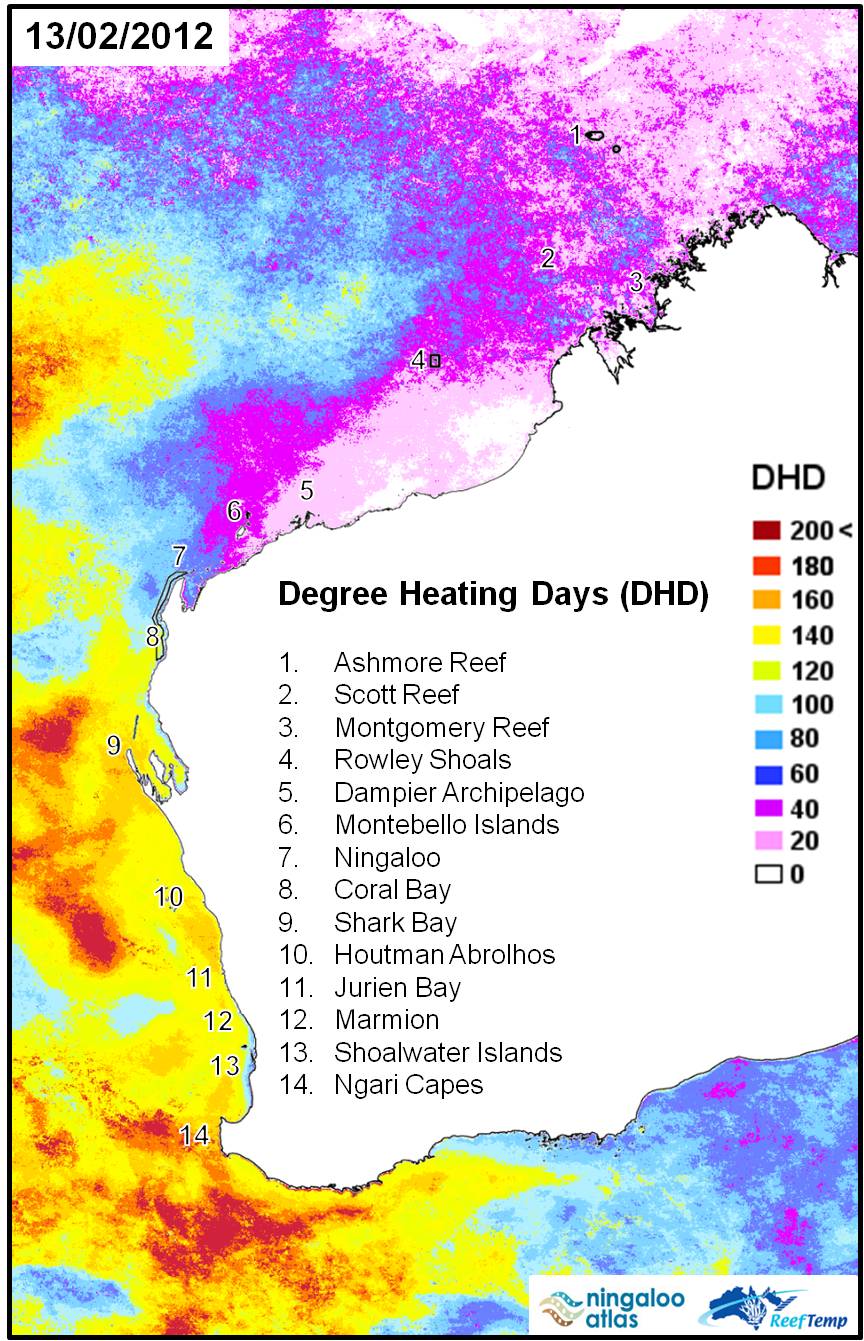
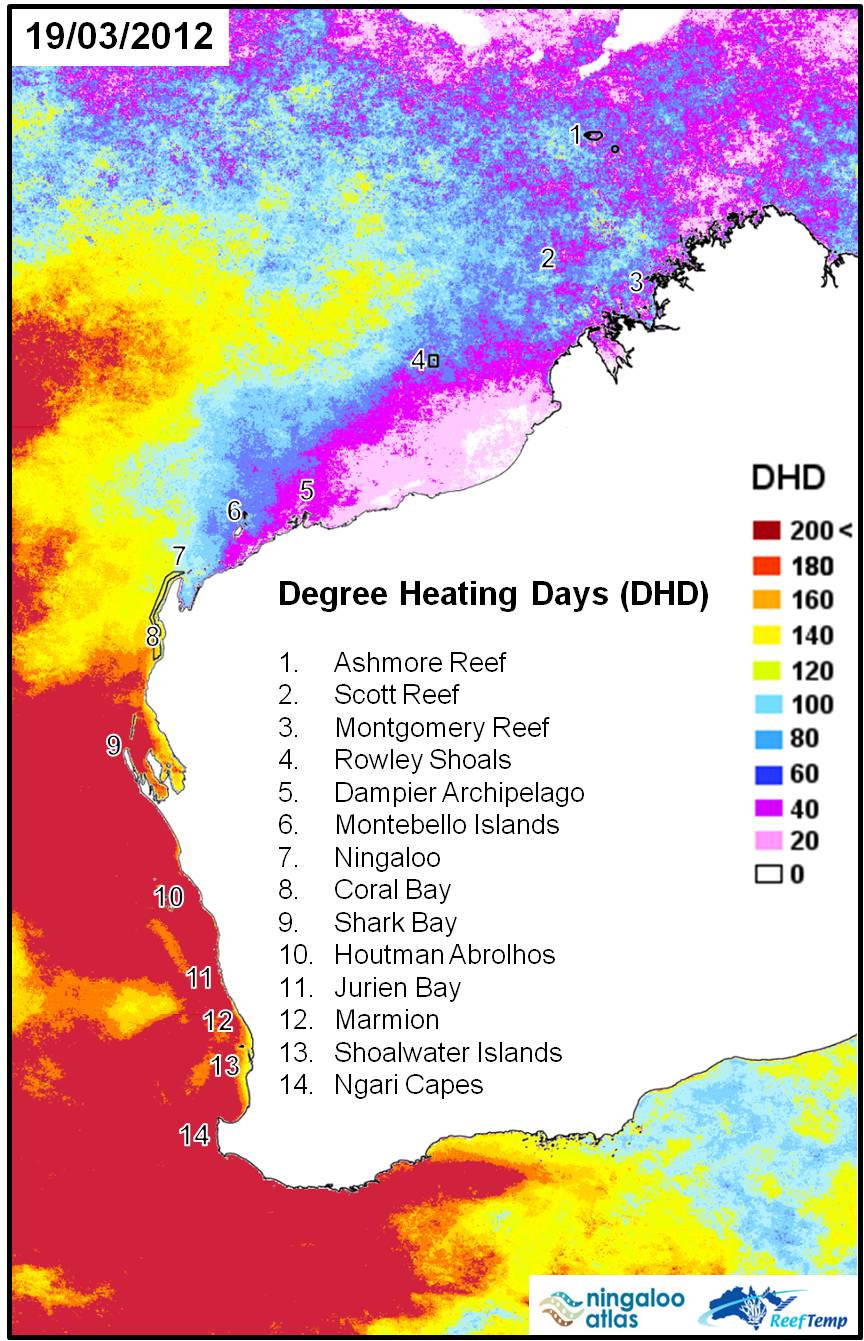
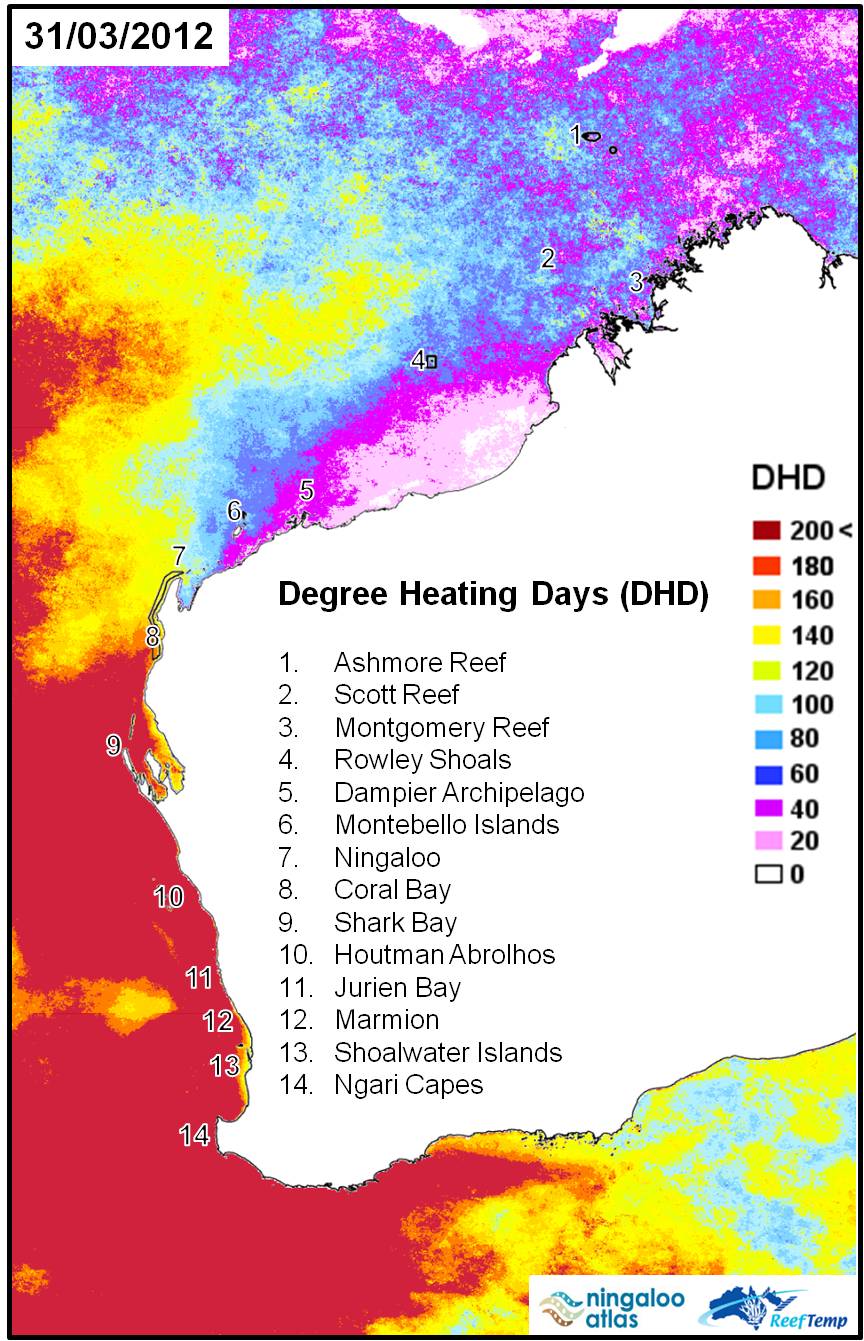
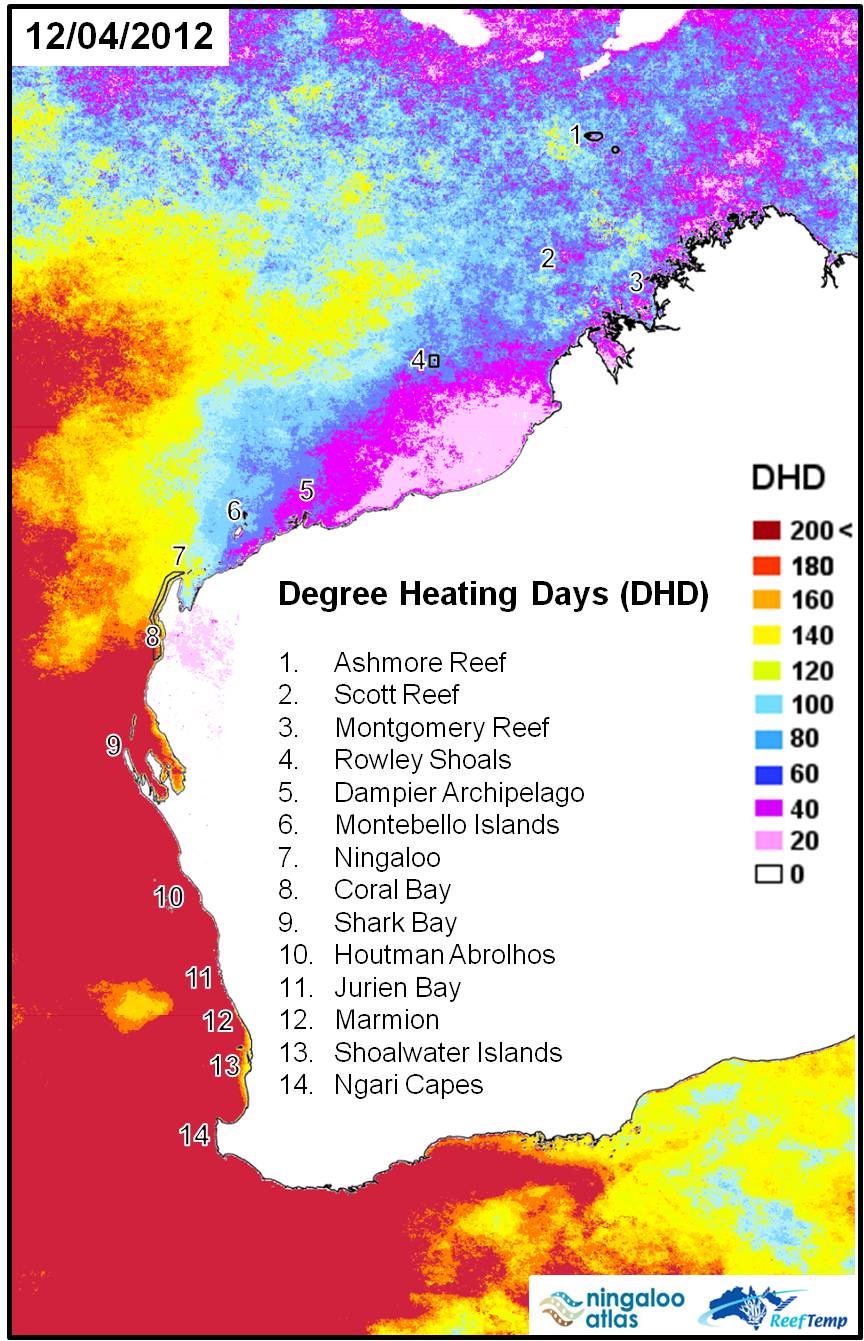
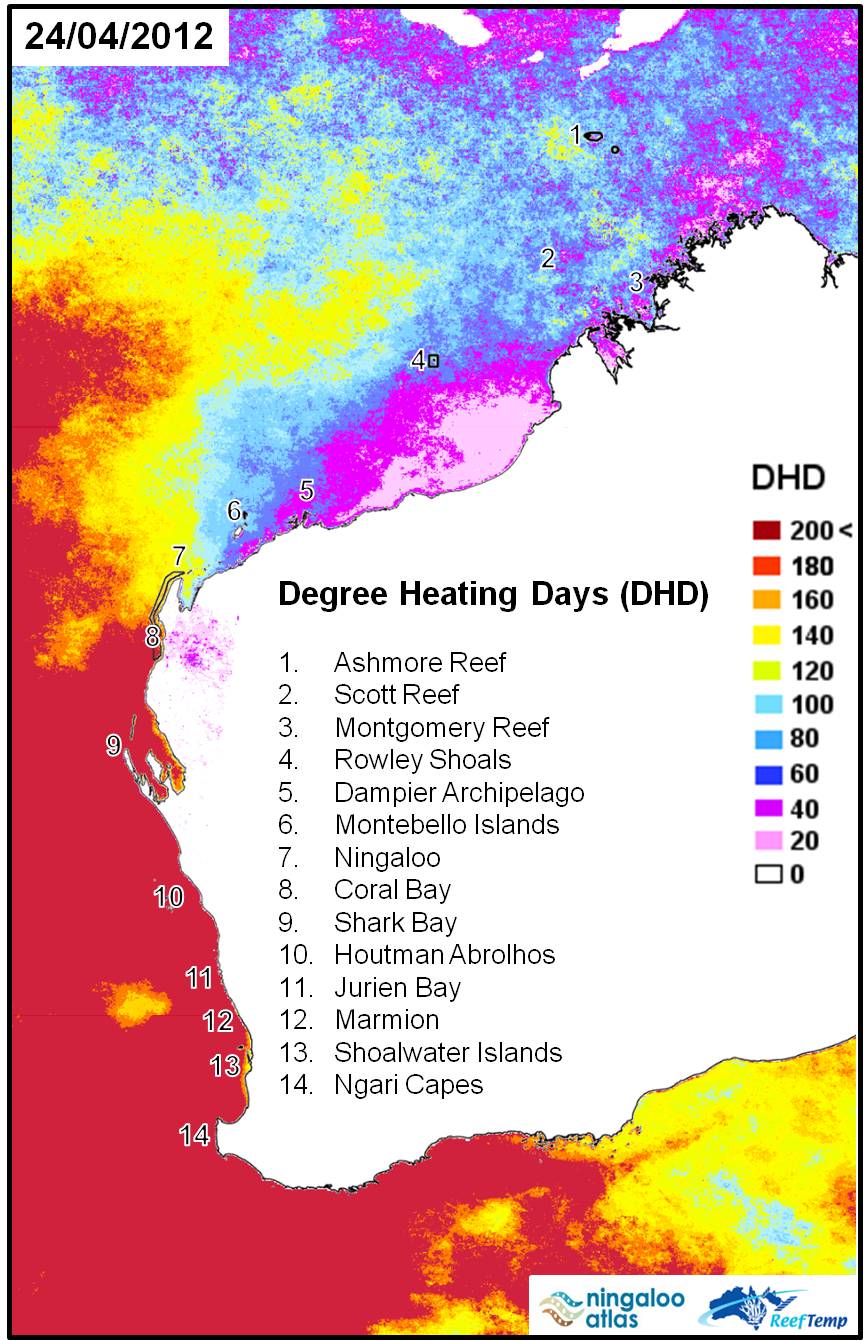
ReefTemp degree heating days (DHD)
One DHD is calculated as 1°C above the local long-term average temperature for one day. The DHD index within ReefTemp is activated on 1 December and displays the number of DHDs accumulated within the period 1 December to 31 March. Predictive values have been established from past Great Barrier Reef bleaching events - see Forecasting coral bleaching events in Western Australia - but these remain indicative and have not been tested for Western Australia reefs.
| click image for larger image view | |||||
|
26 January 2012 |
13 February 2012 |
19 March 2012 |
31 March 2012 |
12 April 2012 |
24 April 2012 |
Figure 3. Composite ReefTemp DHD for Western Australia - selected dates January to April 2012. Data extracted and reworked from http://www.cmar.csiro.au/remotesensing/reeftemp/web/ReefTemp_application.htm. |
|||||
For more information on the technical information and methodology of the SST products, visit POAMA, CRW, and ReefTemp.
For more information of how these SST products are integrated into a more formal operational monitoring and response framework, visit the Great Barrier Reef Marine Park Authority's Coral Bleaching Response Plan.

